


Dashboard & Reports
See how your business is performing at a glance. Dig further as needed.

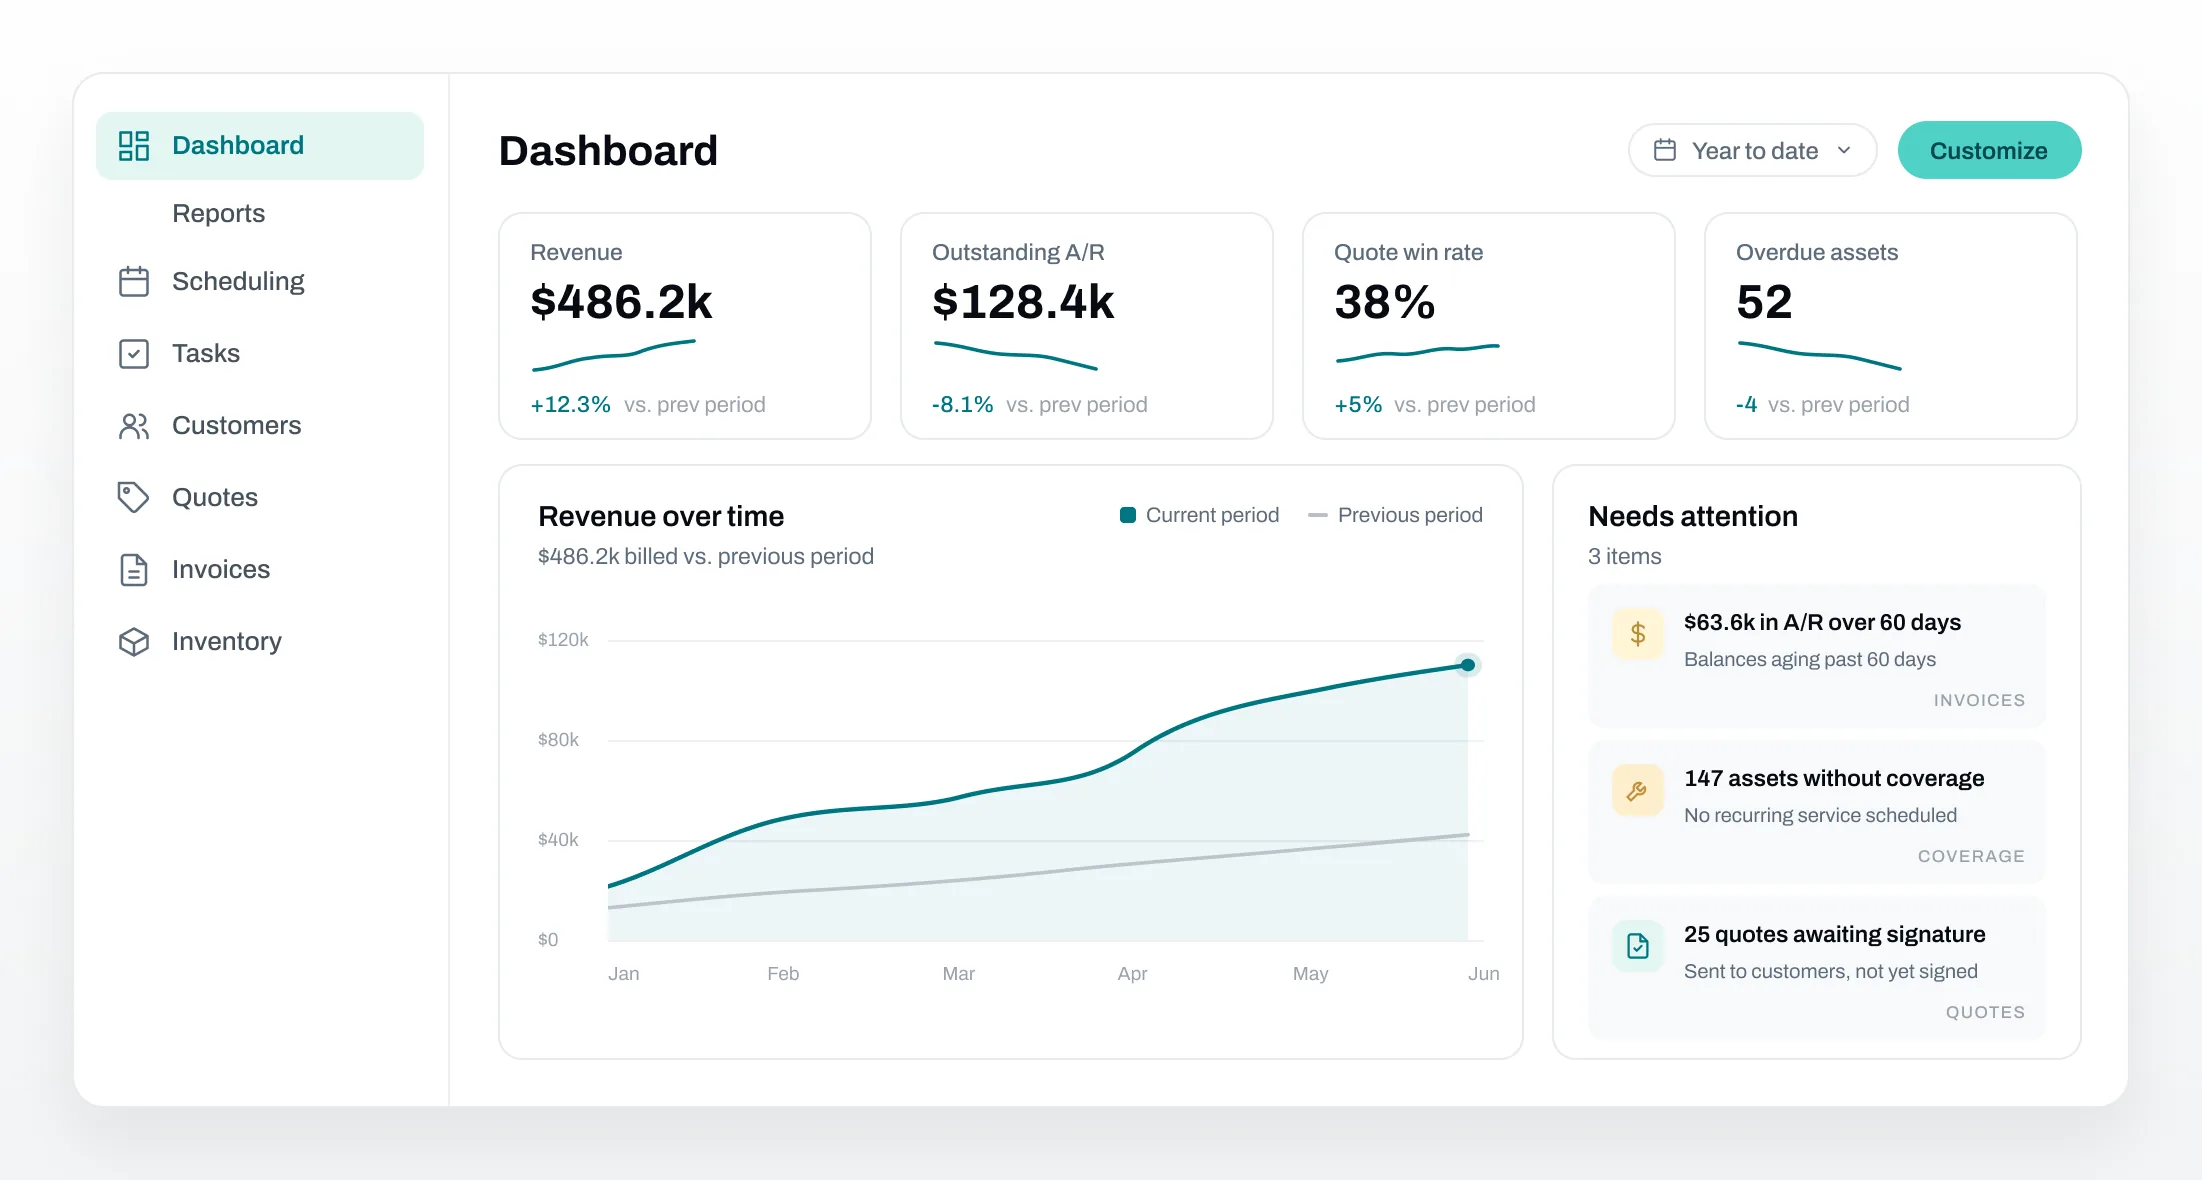


Know how the business is trending
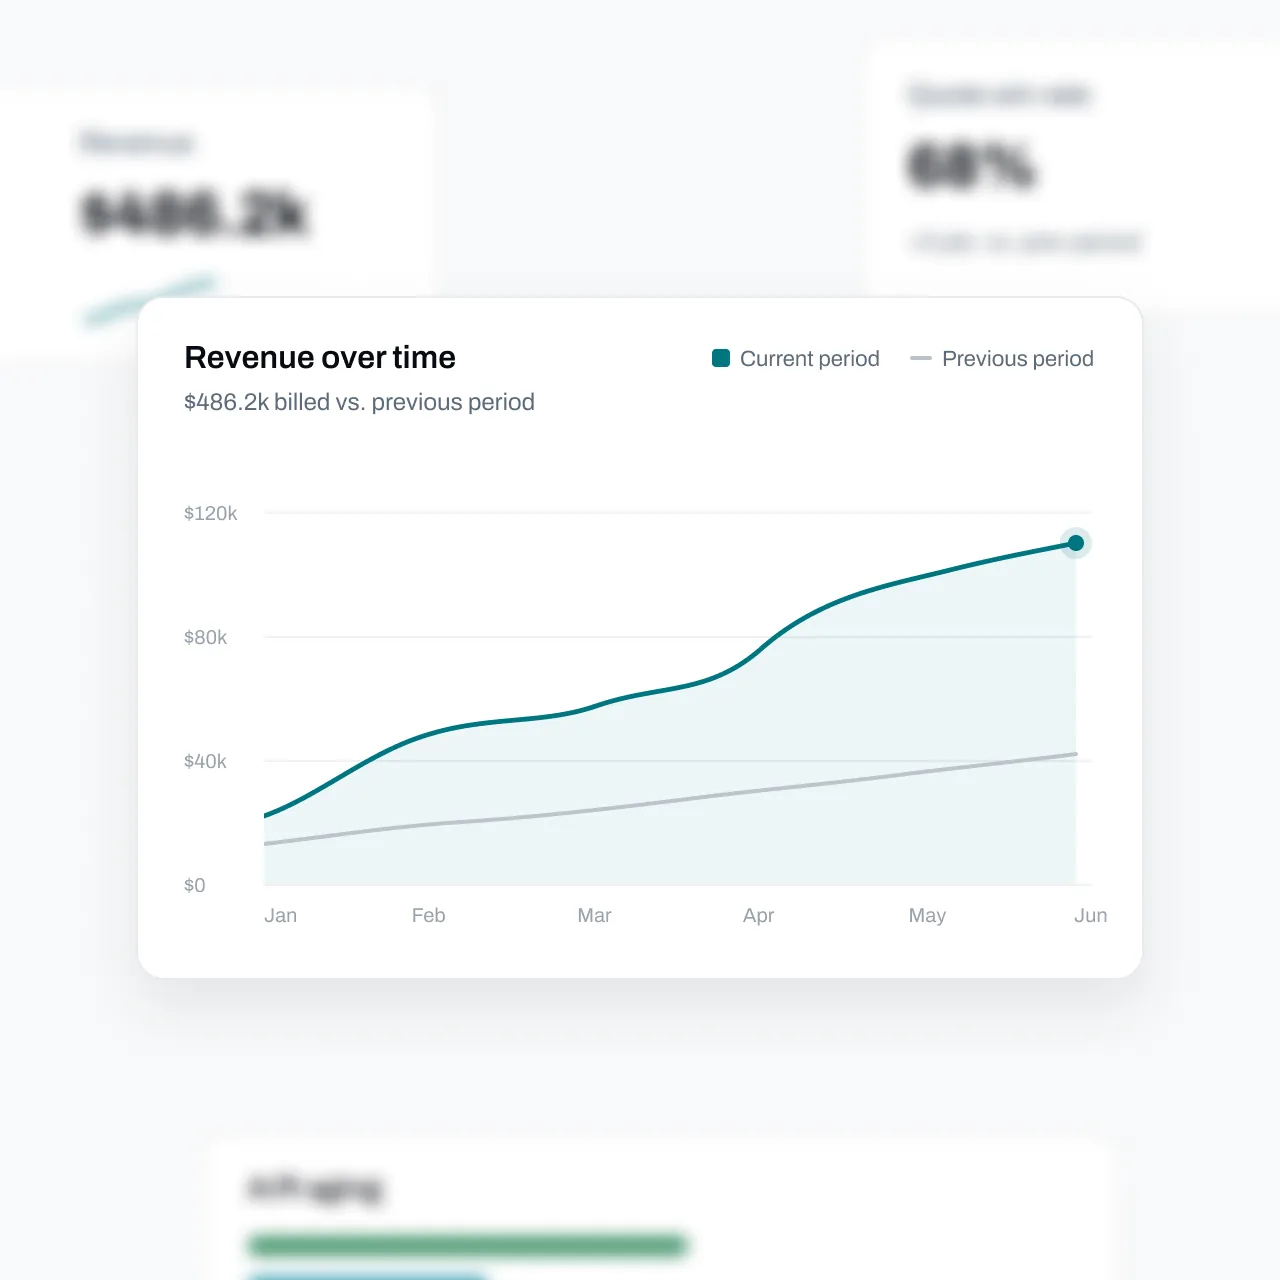
Revenue, outstanding A/R, and quote win rate, tracked live against the previous period. You don't wait for month-end reconciliation to find out where you stand.
Pick a range (last 30 days, this quarter, year to date, or last 12 months) and the whole dashboard follows.
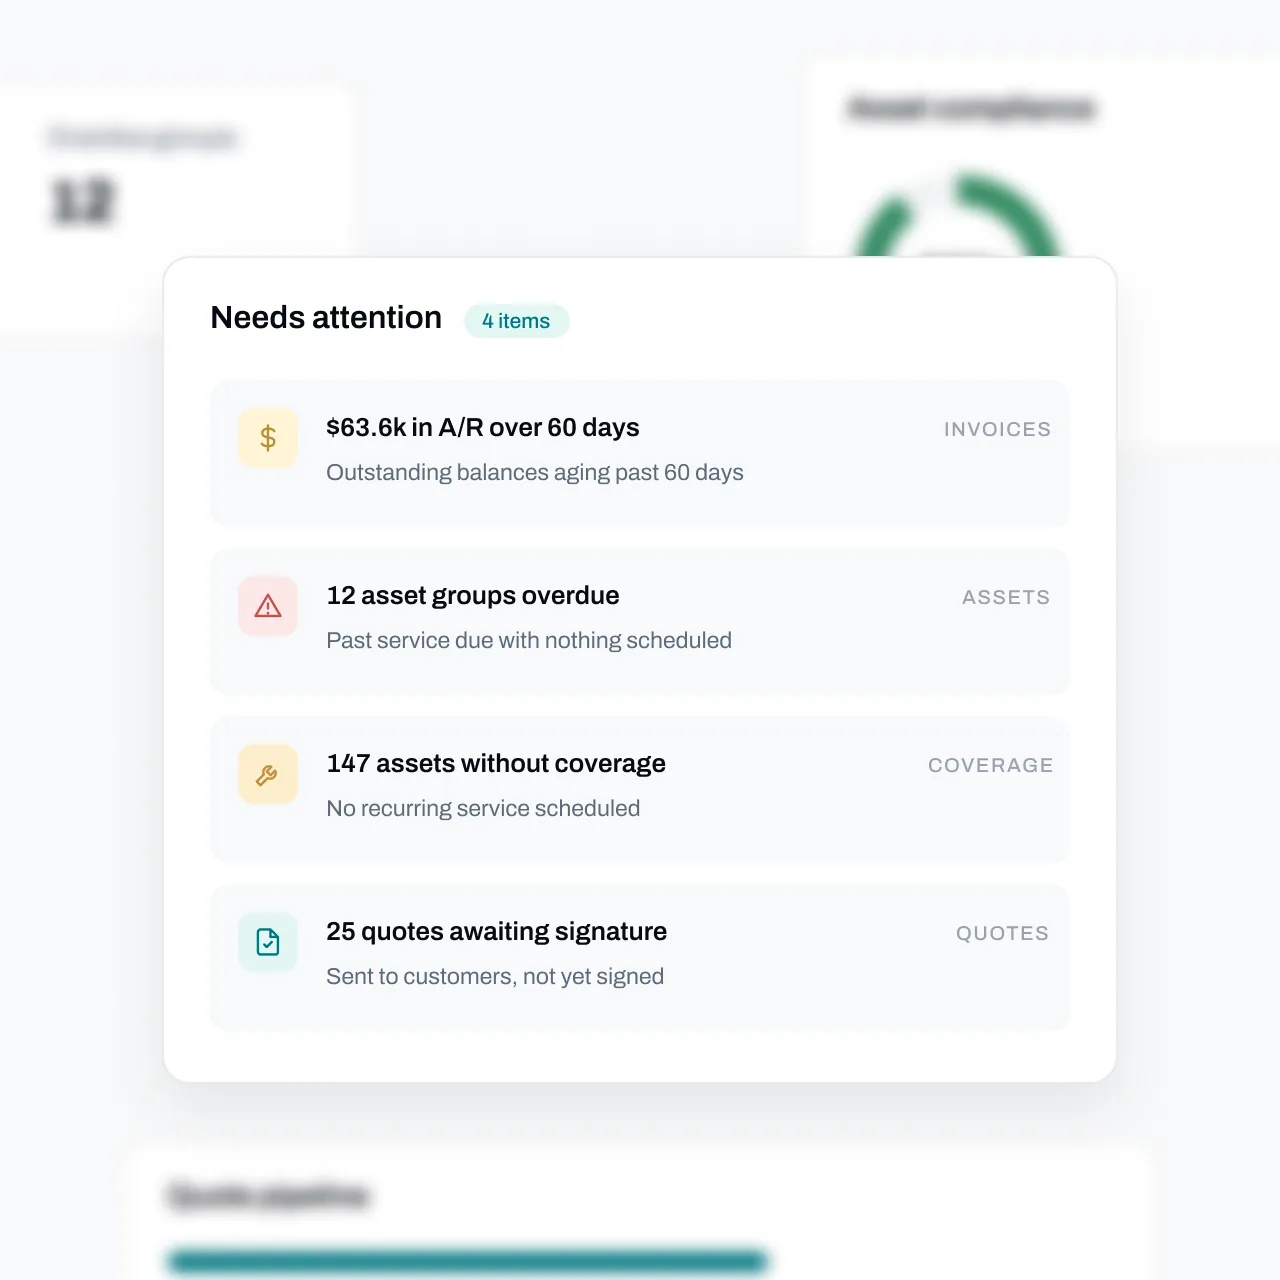
Catch problems while they're still small
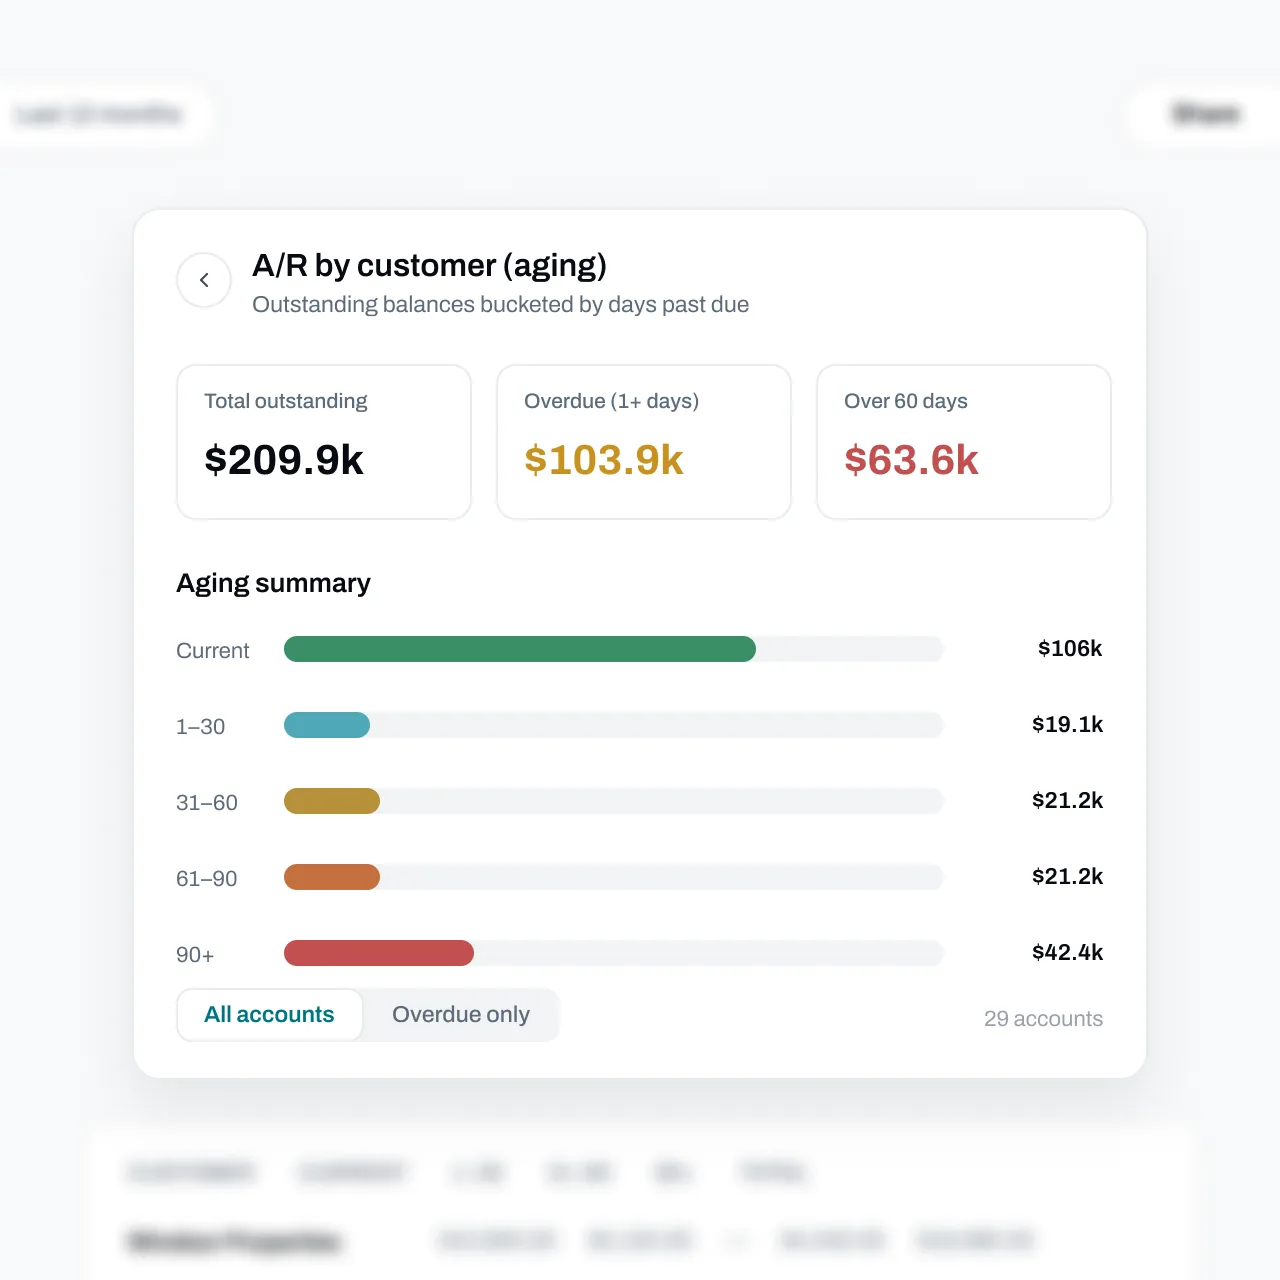
Your dashboard flags what needs action: invoices aging past 60 days, overdue assets with nothing scheduled, quotes still waiting on a signature.
Each item opens the report behind it, so you can see exactly which invoices or assets need the call.
A full report library, zero setup
28 pre-built reports across financials, job costing, sales, and field operations, ready on day one. No spreadsheet exports, no third-party BI tool.
Health-check reports watch your data for you and flag overdue assets and coverage gaps automatically.
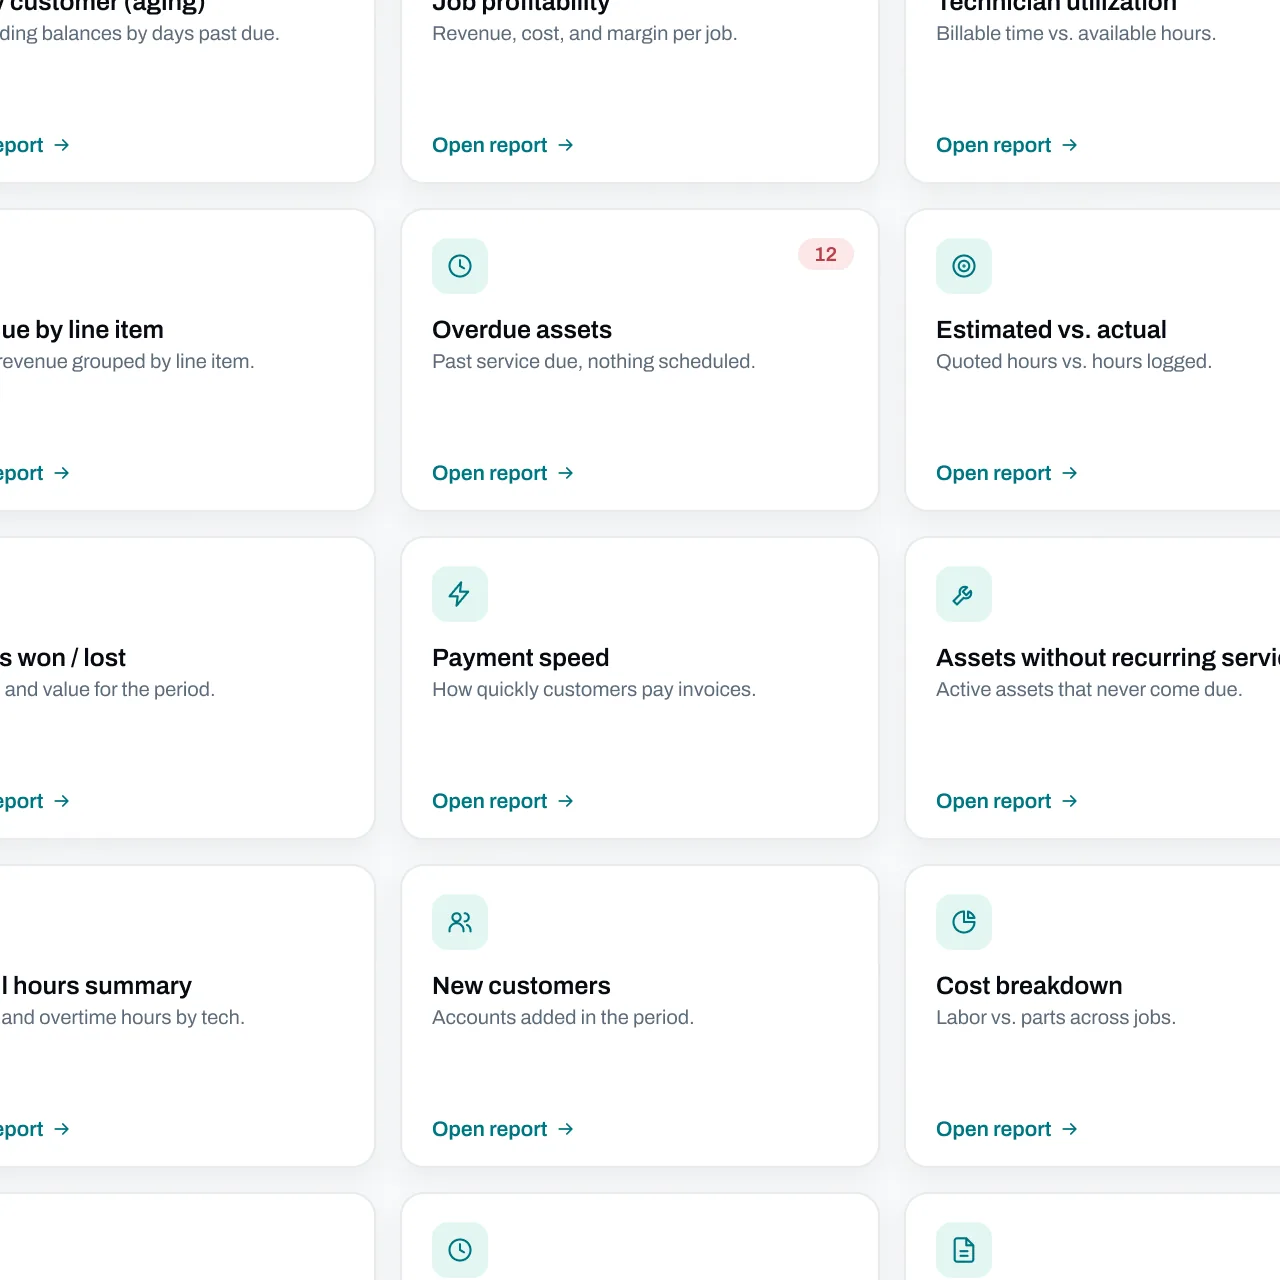
Drill in, then share
Open any report and cut it down by customer, by technician, or with views like "overdue only."
When your accountant or your bank asks for the numbers, export the CSV in one click.
FAQs
Got questions? We've got answers.
Revenue, outstanding A/R, quote win rate, overdue asset groups, new customers, and asset compliance. Each KPI shows a trend sparkline and a comparison against the previous period, and links to a full report when you want the detail behind the number.
Yes. Essential ships with financial reports including A/R aging by customer, amount due by customer and by property, revenue by line item and by customer, and payment speed - built around how fire and life safety contractors actually bill.
Yes. Job costing reports break down revenue, labor, parts, and gross margin per job, compare estimated vs. actual hours, and roll profitability up by technician - so you know which work actually makes money.
Yes. Add, remove, and rearrange widgets to build the view your business needs - an owner can lead with revenue and A/R, while a service manager leads with scheduling and technician activity. Your layout is saved automatically.
No. Dashboards and reports run on your live Essential data, so there's nothing to export into a spreadsheet and no BI tool to buy or connect. Open a report, filter it, and export a CSV when you need to share the numbers.